A Minimal Stack for Scalable Machine Learning
Sep. 6, 2026 · updated Sep. 10, 2026
Goal
In this article, I'd like to provide a good answer to the question:
"What is the simplest technology stack that can support scalable machine learning?"
Definitions
- Doing machine learning is using data to create logic [1].
- A scalable system can utilize an arbitrary amount of computational resources.
Background & Motivation
I've worked on various machine learning projects over the course of 10 years.
I've found that infrastructure has a profound influence on what gets done. If an operation is complicated or risky, people will avoid it.
Use Case
To make this discussion more concrete, I'll index on what I think is an emblematic use case of machine learning infrastructure.
Say we have a set of videos, like this one:
She broke the women's world record here.
And say we want to run a person detection model on the video (running model inference is key to both training & evaluation of machine-learned functionality).
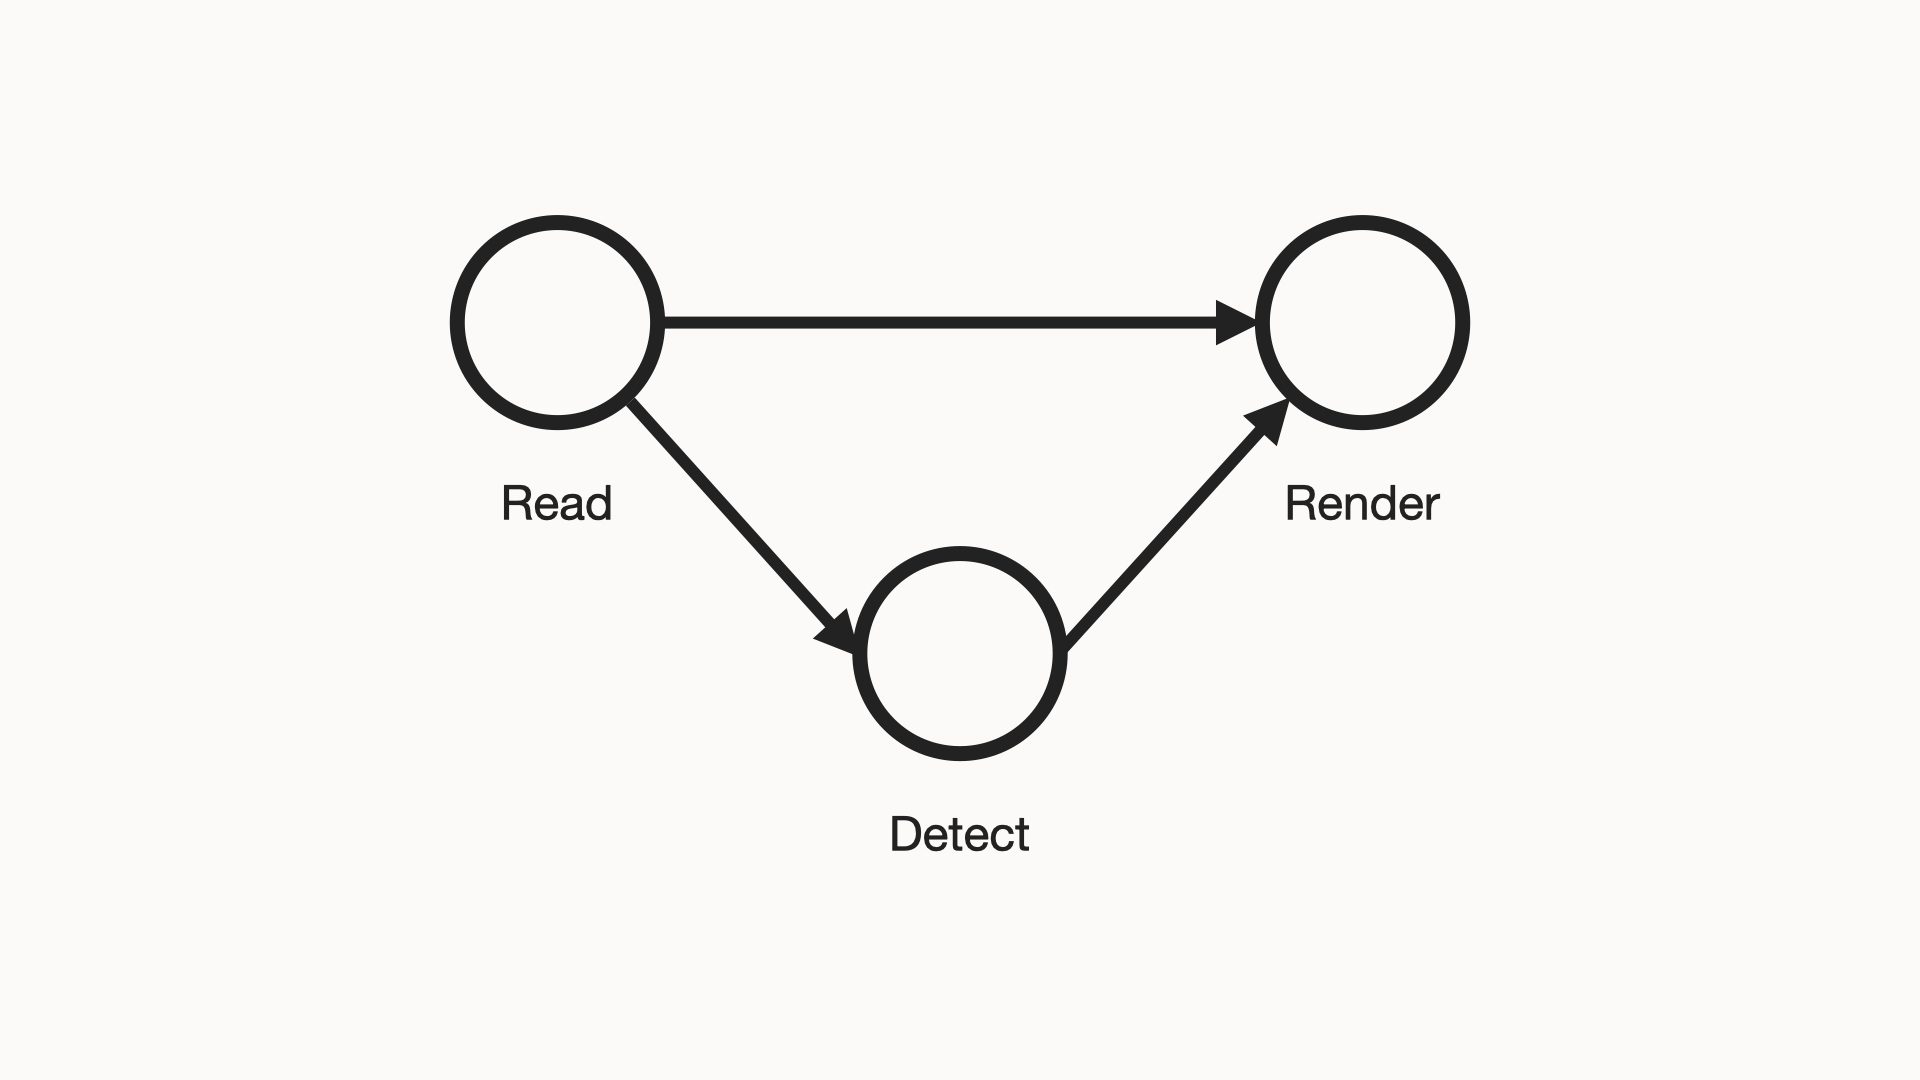
The high-level pipeline we'd like to run is represented in this diagram:
Challenge
To implement this pipeline, 2 key properties need to be attained:
- Correctness. We need to implement the basic functions of the above pipeline.
- Scalability. We need to implement them in a way that scales with more resources.
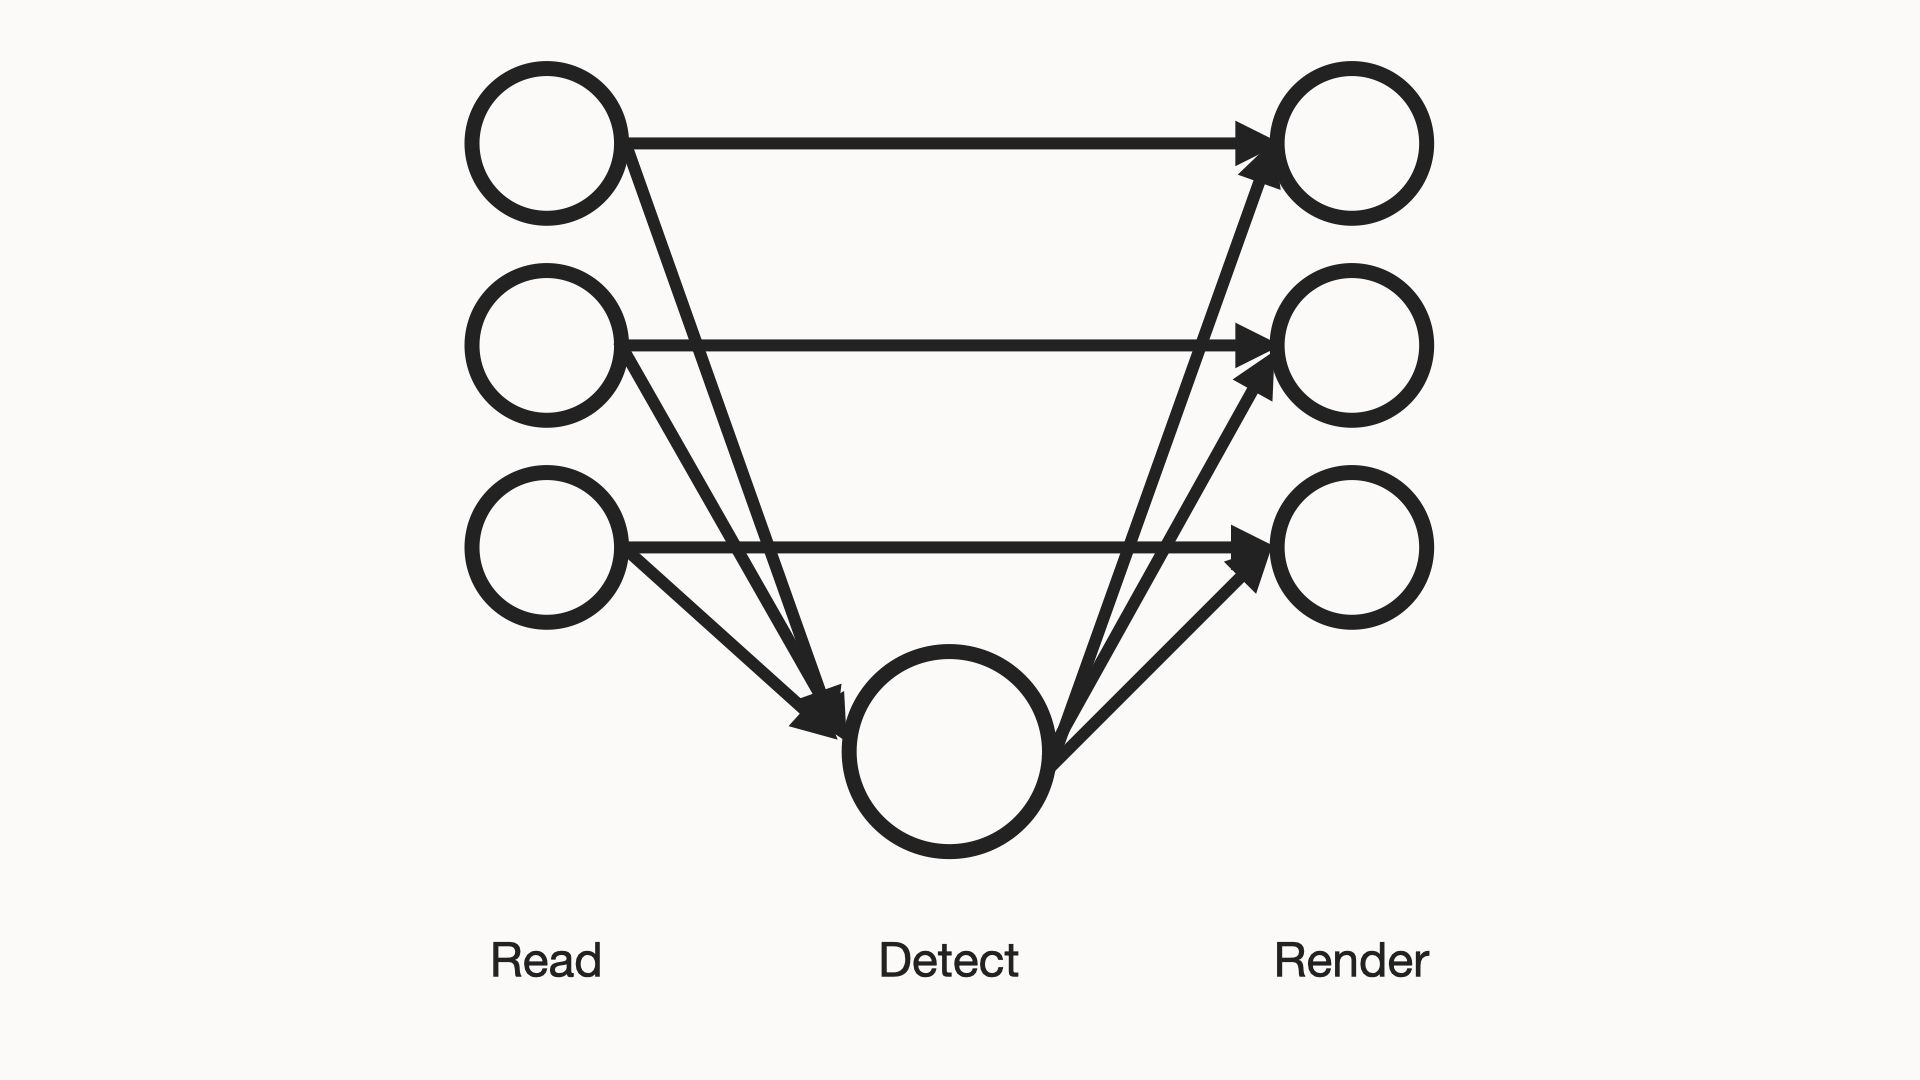
Modularity of the pipeline is important because it will likely be effective to non-uniformly scale stages:
The 2 properties above naturally lend themselves to 2 settings:
- Single-machine. Convenient for attainaing correctness.
- Multi-machine. Necessary for attaining scalability.
Here lies the key challenge to be respected:
Excellent infrastructure must support both above settings in a seamless way.
Proposed Solution
Now that I've established a use-case and its challenges, let me describe what I think is the best solution.
To start, consider the high level technological functions that need to be fulfilled. The following diagram summarizes my view on these.
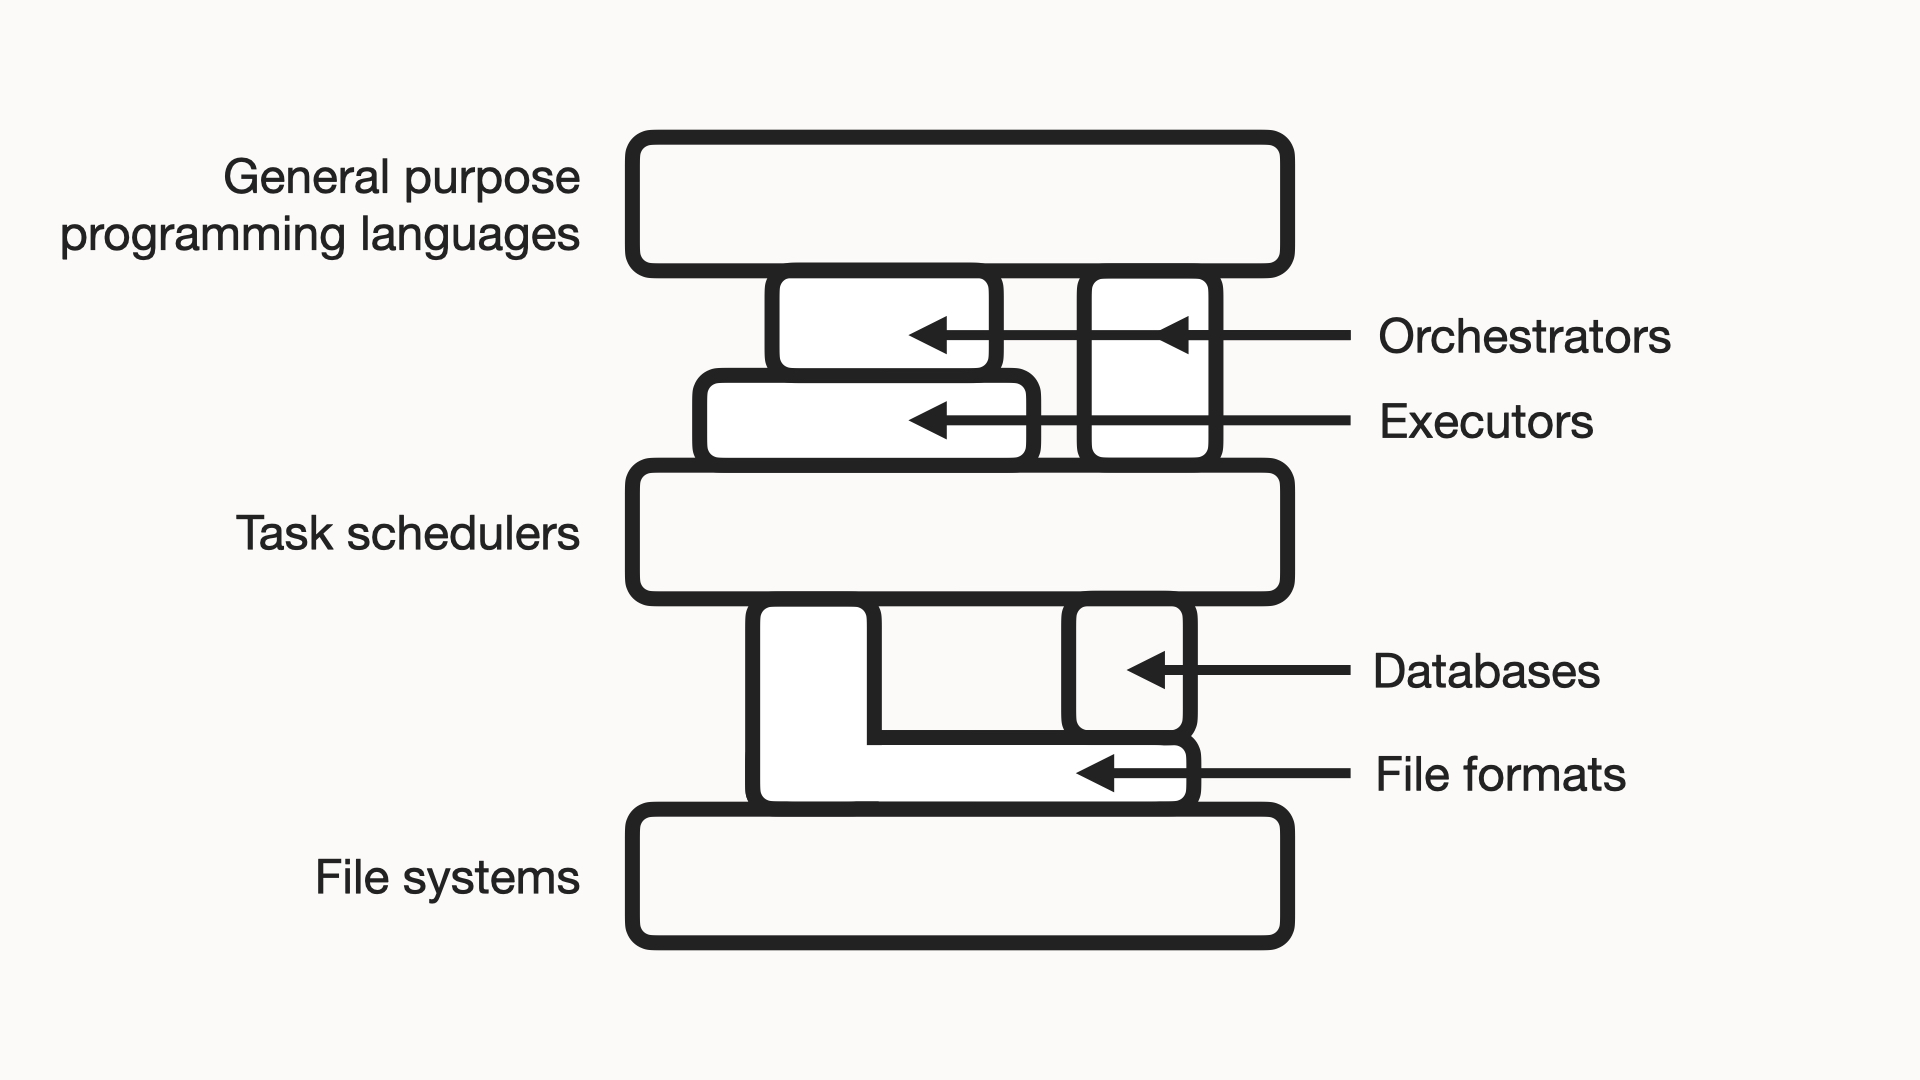
I think the following are the best open-access implementations of these roles, for scalable machine learning use-cases.
| Function | Technologies | Notes |
|---|---|---|
| General purpose programming languages | Python | |
| Orchestrators | Prefect, Beam |
An orchestrator helps resolve stage dependencies. |
| Executors | Spark | An executor helps execute parallel operations. |
| Task schedulers | Slurm, Kubernetes |
On-premises can save a lot of money. |
| Databases | Redis, SQLite, PostgreSQL |
|
| File formats | NPZ, HDF5, JPG, MP4, Parquet |
|
| File systems | GPFS, GCS, S3 |
On-premises can save a lot of money. |
Discussion
I'd like to highlight what I think is the key chord in the above stack:
Beam, Spark, & Kubernetes.
This triple is the best way I see for translating pipeline code from the single-machine setting to the multi-machine setting.
Demonstration
I'll apply the above stack to the above use case.
Single-machine setting for correctness
To start, I'll create a basic correct version of the pipeline.
Code: person_detection.py.
In this file I implement the stages in simple Python:
- Read:
get_frame_batches - Detect:
detect_in_batches - Render:
render_frames&write_video
I can get the pipeline to process this 2:10 video in 1:45 on my desktop:
=================================================================================
Resources
---------------------------------------------------------------------------------
CPU  AMD Ryzen 5 3600 6-Core Processor (6 cores / 12 threads)
RAM  15,932 MiB
GPU  NVIDIA GeForce RTX 2060 (6,144 MiB)

=================================================================================
Top-line statistics
---------------------------------------------------------------------------------
Wall clock time         115.2 s
Samples                 2,167 @ 50 ms
Mean CPU usage          128% of 1,200% (1.3 of 12 cores busy)
Peak RSS usage          9,778 / 15,932 MiB (61%)
Time in GPU phases      27.9% (32.2 s)
GPU usage p50/p90/max   3%/61%/78% (idle baseline: 15%)
Peak GPU used           4,120 / 6,144 MiB (67%, incl. other processes)
Peak torch allocated    1,955 MiB
Peak torch reserved     2,326 MiB

=================================================================================
Per-phase statistics

phase         calls    wall s  % wall      cpu    peak rss  gpu util     peak gpu
---------------------------------------------------------------------------------
render        3,256     64.94   56.4%     104%   9,746 MiB        7%       41 MiB
encode        3,256     42.12   36.6%     103%   9,746 MiB        8%       41 MiB
detect           51     21.62   18.8%     102%   9,746 MiB       52%    1,126 MiB
decode          123     12.14   10.5%     427%   9,778 MiB        4%       41 MiB
warmup            1     10.57    9.2%      35%   5,519 MiB        5%       61 MiB
---------------------------------------------------------------------------------
accounted              151.39  131.4%

=================================================================================
Notes
---------------------------------------------------------------------------------
"cpu" column is for this process, summed over cores. 100% is one busy core.
"gpu util" column is coarse (1s driver window) and over all processes.
Tigst Assefa finishing the 2023 Berlin Marathon.
Analysis of GPU stages
GPU's are costly devices, so I'd like to see what I'm getting out of mine.
When I turn the GPU off, I see:
Wall clock time         261.5 s

phase         calls    wall s  % wall      cpu    peak rss  gpu util     peak gpu
---------------------------------------------------------------------------------
render        3,256     66.82   55.7%     101%   9,429 MiB        8%       41 MiB
encode        3,256     42.79   35.7%     102%   9,429 MiB        6%       41 MiB
detect           51     24.82   20.7%      86%   9,434 MiB       44%    1,508 MiB
decode          123     16.39   13.7%     339%   9,417 MiB        6%       41 MiB
warmup            1      6.37    5.3%      46%   5,516 MiB        1%       58 MiB
---------------------------------------------------------------------------------
accounted              157.19  131.1%

...
ran detection on 64 frames, 42.2 ms/frame; profile: detect: 2,700 ms, CPU 743%, GPU 0% mean GPU util, 0 MiB peak torch alloc
ran detection on 64 frames, 42.3 ms/frame; profile: detect: 2,705 ms, CPU 753%, GPU 0% mean GPU util, 0 MiB peak torch alloc
ran detection on 64 frames, 42.1 ms/frame; profile: detect: 2,696 ms, CPU 757%, GPU 0% mean GPU util, 0 MiB peak torch alloc
Whereas when it's on, I see:
Wall clock time         119.9 s

phase         calls    wall s  % wall      cpu    peak rss  gpu util     peak gpu
---------------------------------------------------------------------------------
detect           51    175.67   67.2%     675%   9,233 MiB        0%        0 MiB
render        3,256     63.62   24.3%     100%   9,232 MiB        0%        0 MiB
encode        3,256     41.93   16.0%     101%   9,232 MiB        0%        0 MiB
decode          123      9.59    3.7%     517%   9,233 MiB        0%        0 MiB
warmup            1      8.74    3.3%      53%   5,042 MiB        0%        0 MiB
---------------------------------------------------------------------------------
accounted              299.56  114.6%

...
ran detection on 64 frames, 7.0 ms/frame; profile: detect: 449 ms, CPU 128%, GPU 6% mean GPU util, 1,087 MiB peak torch alloc
ran detection on 64 frames, 5.8 ms/frame; profile: detect: 371 ms, CPU 104%, GPU 8% mean GPU util, 1,088 MiB peak torch alloc
ran detection on 64 frames, 5.4 ms/frame; profile: detect: 343 ms, CPU 107%, GPU 17% mean GPU util, 1,088 MiB peak torch alloc
A (175.67 s / 24.82 s) ~= 7x speedup on the "detect" stage.
From a basic search, it seems the costs of these resources on Google Cloud are about:
- $0.19/h for an "n1-standard-4" 4-core CPU node
- $0.54/h for an "n1-standard-4-t4" 4-core CPU & T4 GPU node
A ($0.54 / $0.19) ~= 3x cost difference.
So, when scaling this pipeline, it would make sense to pay for a GPU to run detection on. The stage would be ~7x faster and (175.67 s / 24.82 s) / ($0.54 / $0.19) ~= 2.5x cheaper.
Analyis of CPU stages
Most of the pipeline's wall clock time is in the "render" & "encode" stages (93%!).
Probably, these stages can be sped up by using concurrency and using the GPU.
Multi-machine setting for scalability
Now, let's say I want to scale the above pipeline.
(There are optimizations that can be made, but let's say I have time urgency, and I am ok with accepting the core pipeline code as is).
Code: person_detection_beam.py.
In this file I re-use the above functions to implement the stages in the Python Beam API:
- Read:
beam.Create(split_video) - Detect:
beam.ParDo(DetectChunk) - Render:
beam.ParDo(RenderChunk)&beam.Map(concatenate_in_order)
I set up a kind (Kubernetes in Docker) cluster on my desktop, to simulate
having a large Kubernetes cluster to run on (see
kind_config.yaml,
k8s, &
docker).
I can submit my pipeline to that cluster:
$ python person_detection_beam.py ../data/sports/womens_marathon_record_2023.mp4 \
>     --video-chunk-size-s 10 \
>     --runner=PortableRunner \
>     --worker-root /mnt/project \
>     --job_endpoint=localhost:8099 \
>     --artifact_endpoint=localhost:8098 \
>     --environment_type=EXTERNAL \
>     --environment_config=localhost:50000
Split ../data/sports/womens_marathon_record_2023.mp4 into 13 chunk(s)
Job state changed to STOPPED
Job state changed to STARTING
Job state changed to RUNNING
Job state changed to DONE
Wrote ../data/sports/womens_marathon_record_2023_output.mp4
And watch it run:
$ kubectl get nodes
NAME                         STATUS   ROLES           AGE   VERSION
mini-cluster-control-plane   Ready    control-plane   19h   v1.31.0

$ kubectl get pods
NAME                               READY   STATUS                     RESTARTS      AGE
beam-job-server-659fdf49dc-2tvsz   1/1     Running                    0             3m40s
spark-master-c997cf78b-sg8n6       1/1     Running                    1 (12h ago)   19h
spark-worker-7977679bfc-t95vf      2/2     Running                    0             12h
This setup affords me 2 key abilities:
- Scale. I can scale the stages up to sizes that would be too large for one machine.
- Non-uniform scale. I can scale different stages differently. E.g. scaling the CPU stages most, like in the "Potential scaled detection pipeline" diagram.
Conclusion
In this post I've described the technology setup that I think most simply supports the single-machine & multi-machine settings for machine learning.