The Alchemy of Semi-Supervision
Oct. 7, 2026
Overview
Here, I study an ML method that I think is powerful & under-used: semi-supervision.
Summary
In my experiments, semi-supervision increases precision and decreases variance.
The code for this project is at github.com/skeselj/semi-sup-seg.
Background
Supervised Learning
Is about estimating a distribution given observations of .
E.g. least-squares linear regression.
Unsupervised Learning
Does not have a dependent variable , it's about finding structure in just .
E.g. k-means clustering.
Self-Supervised Learning
Constructs a convenient task, to help with eventual tasks.
E.g. language modeling.
Semi-Supervised Learning
Extends the dataset with a model's own predictions .
E.g. this paper for 2D object detection, this paper for 3D object detection.
Motivation
Semi-supervised learning is unique in a fascinating way: it's recursive.
If it works, it supports a certain induction on model quality: model supports creation of superior , and so on.
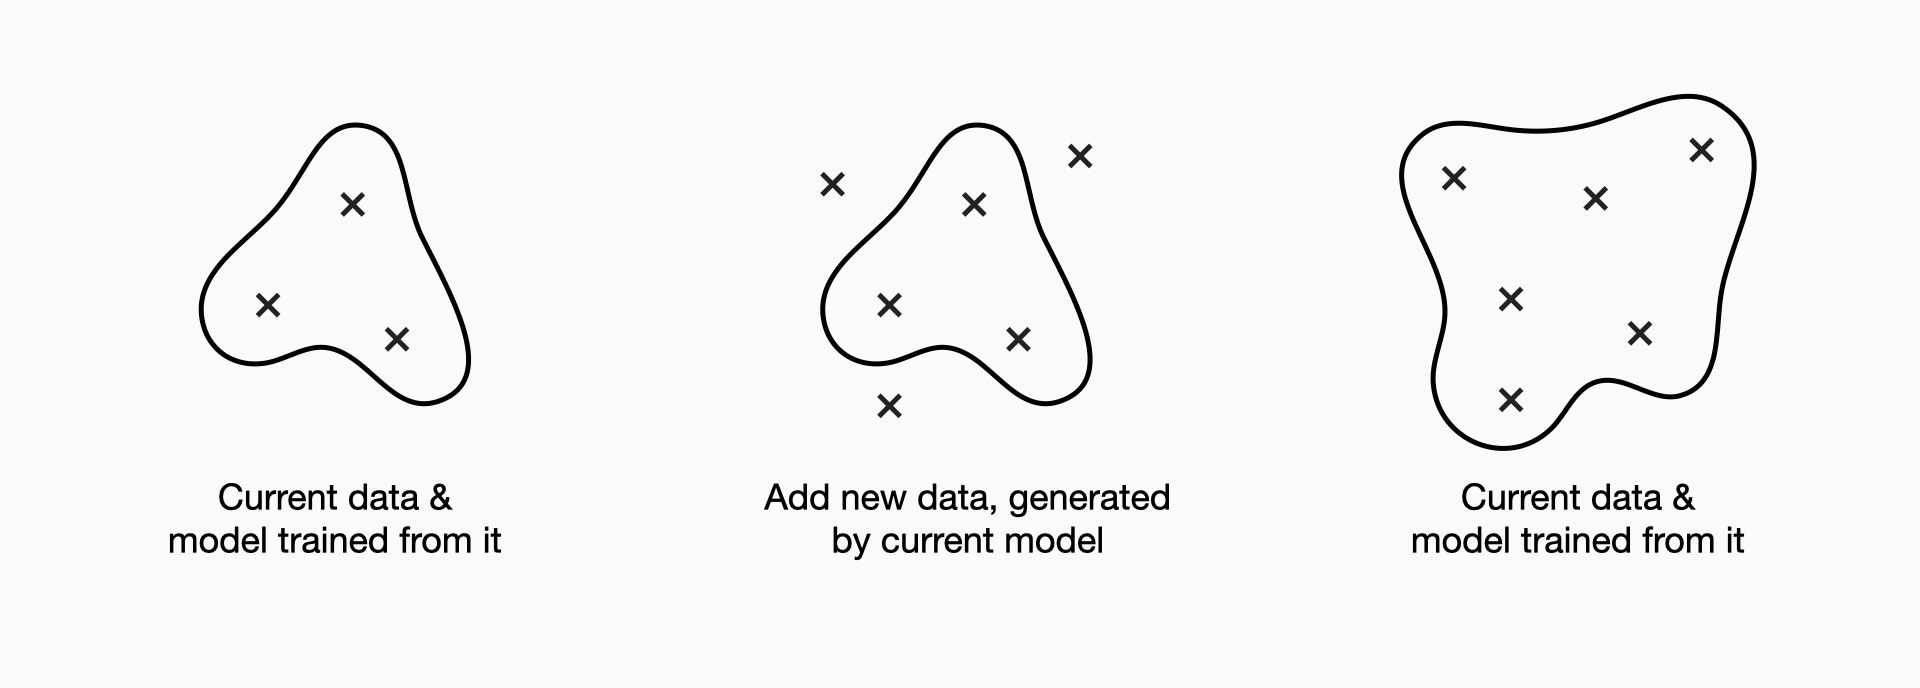
The method has had success, e.g. Naive Student set Cityscapes SOTA in 2020.
But, in my opinion, it remains less understood and widespread than it could be.
Goal
I want to get a better understanding of the nature of semi-supervision: what can it do, and what can't it do?
Approach
I'll set up a basic application, and measure the effect of introducing semi-supervision.
Task
I'll focus on the semantic segmentation task. I think it's the most simply posed task in computer vision (more on that in the glossary).
Data
I'll focus on the Cityscapes dataset. It's a high quality benchmark.
The image data comes from a set of recordings indexed by (city, clip, frame).
Some images are labeled [1]. E.g. this video highlights labeled frames
from Zurich:
I'll focus on just person[2] detection. I think it's the hardest and also most important of the 30 Cityscapes classes.
The data come from a variety of cities in 3 countries:
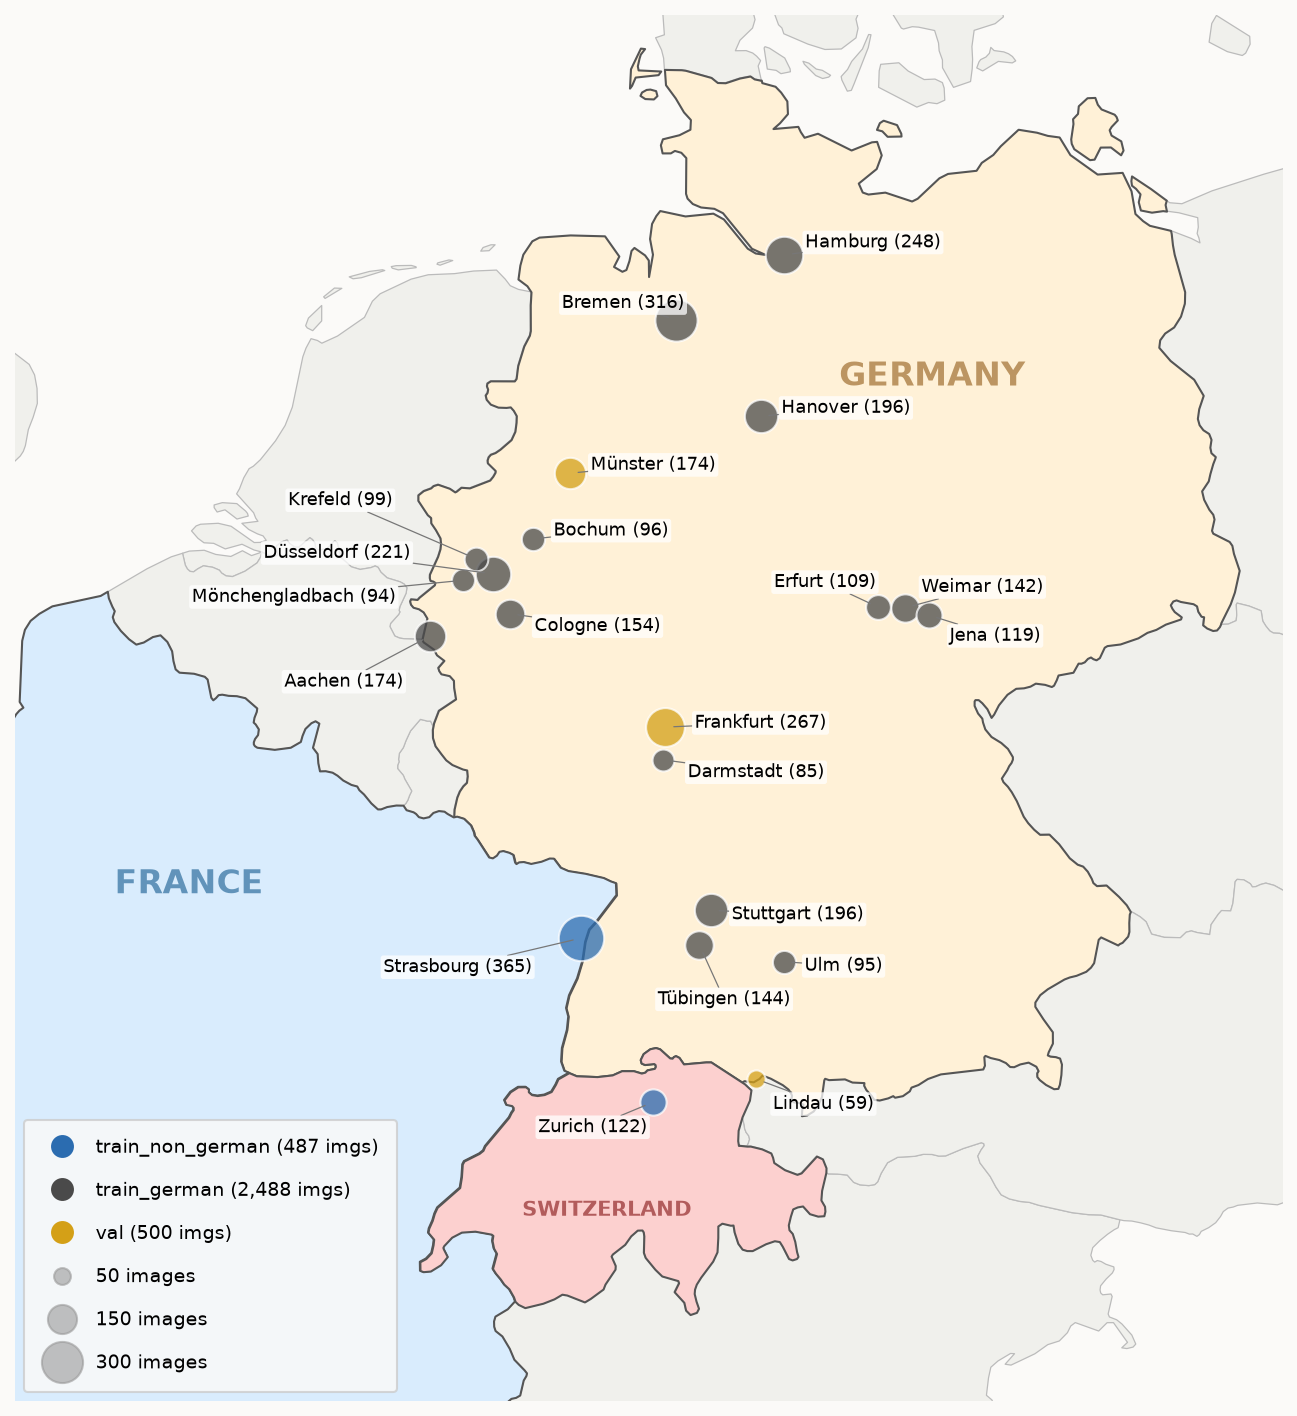
I will constrain the set of labeled training data to just the 2 non-German cities:
Labeled data

	train_non_german:
		strasbourg          :     365 datapoints from       2 clips
		zurich              :     122 datapoints from     122 clips
		-----------------------------------------------------------
		total               :     487 datapoints

	val:
		frankfurt           :     267 datapoints from       2 clips
		munster             :     174 datapoints from     174 clips
		lindau              :      59 datapoints from      59 clips
		-----------------------------------------------------------
		total               :     500 datapoints


Unlabeled data

	train_non_german:
		strasbourg          :  10,950 datapoints from       2 clips
		zurich              :   3,660 datapoints from     122 clips
		-----------------------------------------------------------
		total               :  14,610 datapoints

	train_german:
		bremen              :   9,480 datapoints from     316 clips
		hamburg             :   7,440 datapoints from       1 clips
		dusseldorf          :   6,630 datapoints from     221 clips
		hanover             :   5,880 datapoints from       1 clips
		stuttgart           :   5,880 datapoints from     196 clips
		aachen              :   5,220 datapoints from     174 clips
		cologne             :   4,620 datapoints from     154 clips
		tubingen            :   4,320 datapoints from     144 clips
		weimar              :   4,260 datapoints from     142 clips
		jena                :   3,570 datapoints from     119 clips
		erfurt              :   3,270 datapoints from     109 clips
		krefeld             :   2,970 datapoints from       1 clips
		bochum              :   2,880 datapoints from       1 clips
		ulm                 :   2,850 datapoints from      95 clips
		monchengladbach     :   2,820 datapoints from       2 clips
		darmstadt           :   2,550 datapoints from      85 clips
		-----------------------------------------------------------
		total               :  74,640 datapoints

	val:
		frankfurt           :   8,010 datapoints from       2 clips
		munster             :   5,220 datapoints from     174 clips
		lindau              :   1,770 datapoints from      59 clips
		-----------------------------------------------------------
		total               :  15,000 datapoints
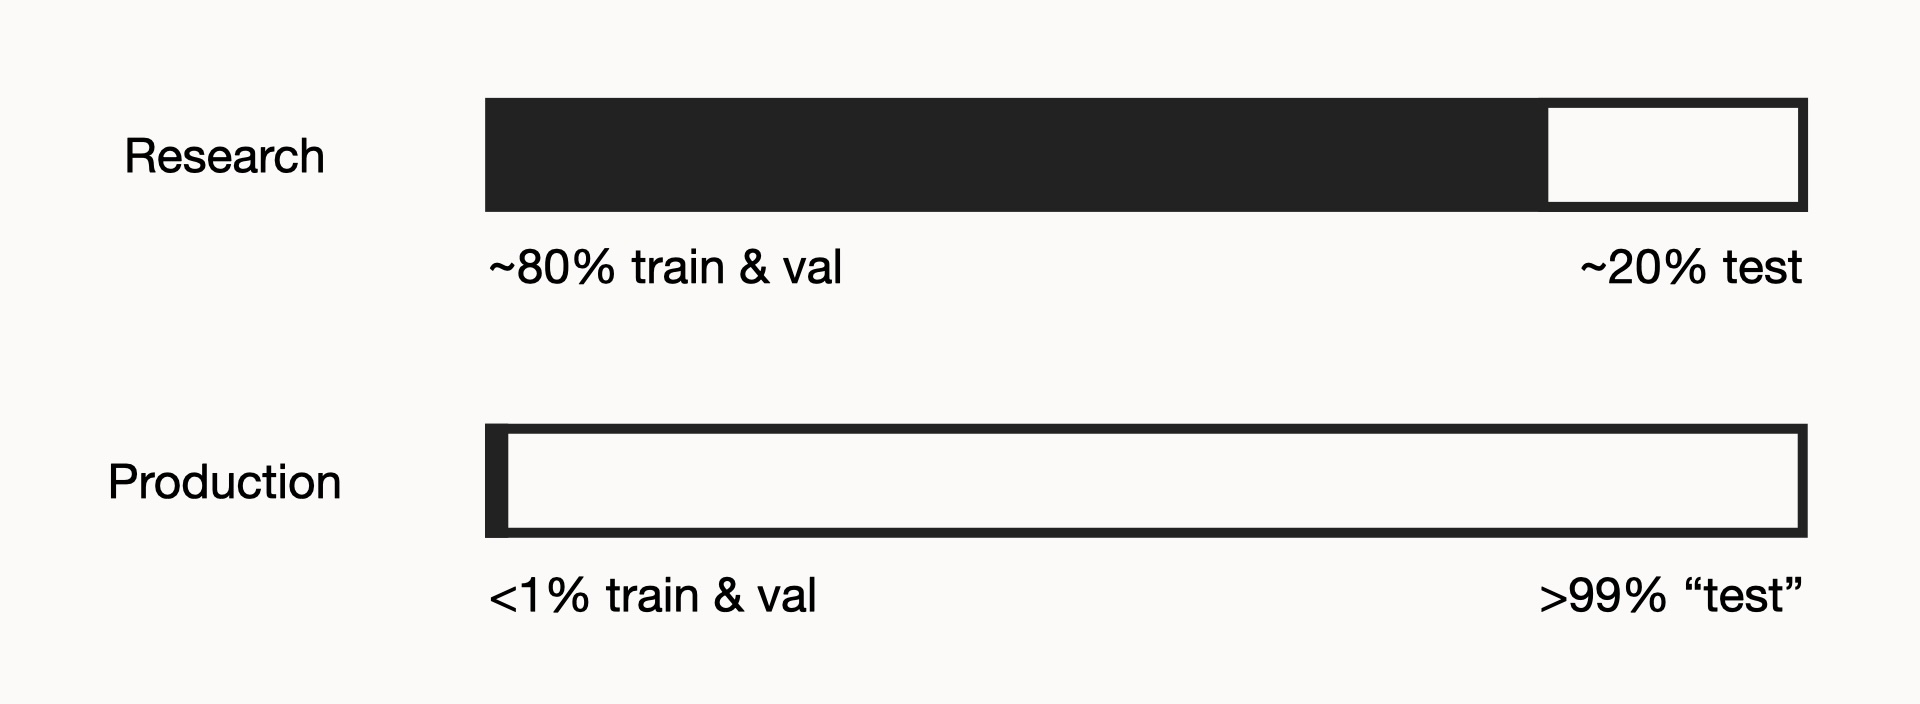
I think this will make the situation more aligned with the production ML setting:
Model
I'll use a mostly standard U-Net, with these core parameters:
Defined a U-Net over 5 levels, with (C, H, W) shaped feature maps.
   level 0: encoder (  32,  256,  512), decoder (  32,  256,  512), 3x3 convs
   level 1: encoder (  64,  128,  256), decoder (  64,  128,  256), 3x3 convs
   level 2: encoder ( 128,   64,  128), decoder ( 128,   64,  128), 5x5 convs
   level 3: encoder ( 256,   32,   64), decoder ( 256,   32,   64), 5x5 convs
   level 4: encoder ( 512,   16,   32), decoder none, 5x5 convs
My non-standard choice is using GroupNorm
with num_channels=16 [3].
Code: unet.py.
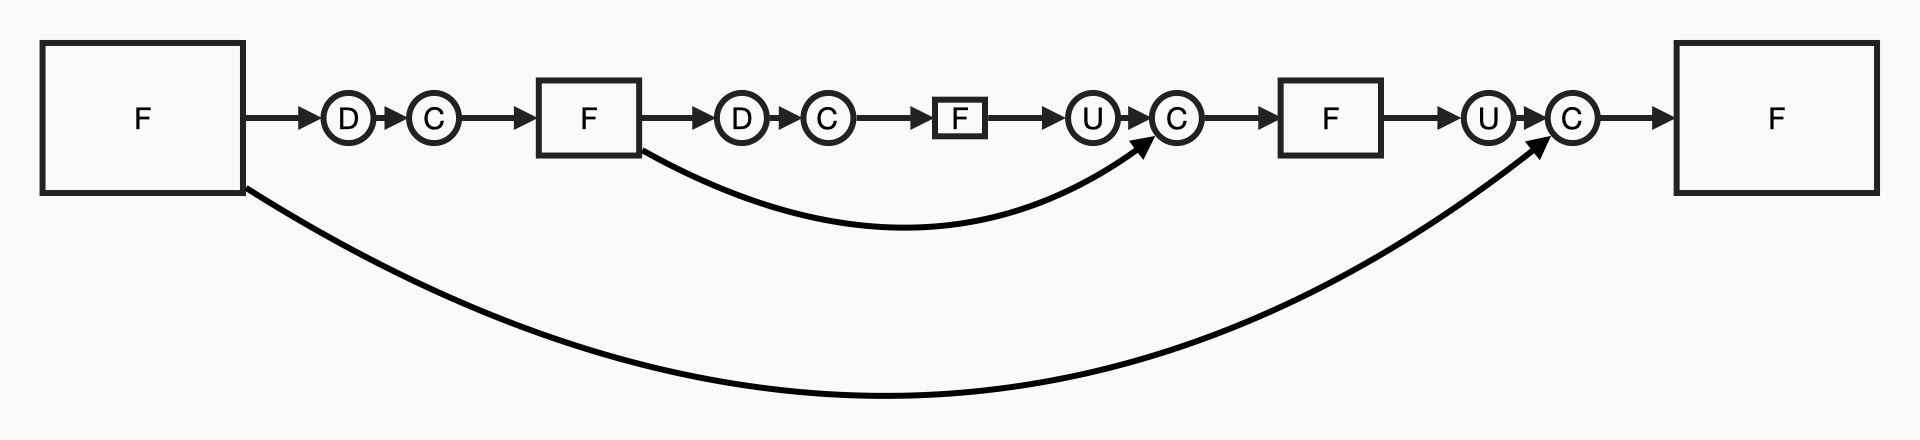
DeepLab & MaskFormer can do better than U-Net. But U-Net is simple and sufficiently expressive for this study.
Experiments
I've set up the application specification. Now I'll try different training procedures for it.
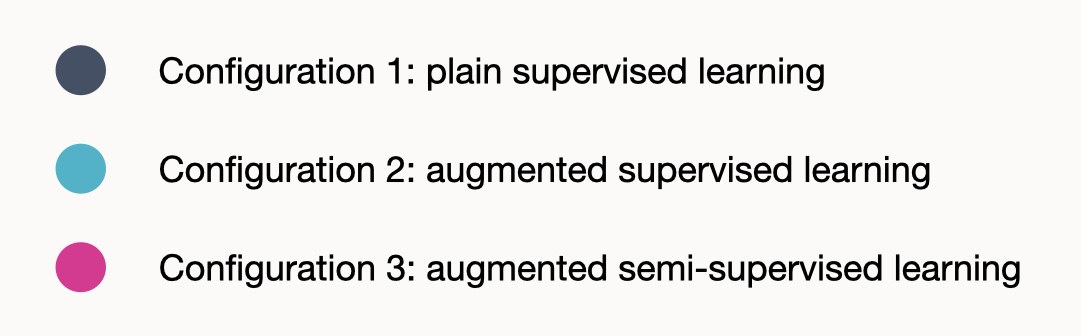
Configuration 1: plain supervised learning
Idea:
- Start with the simplest non-trivial approach.
Details:
- The training dataset is the 487 labeled training frames.
- The loss function is cross entropy between labels & predicted probabilities.
- The batch size is 8.
- The optimizer is AdamW
with defaults, except learning rate is
5e-5, not1e-3.
Code:
TRAINING_PRESETS["sup"]in train_config.py.
Configuration 2: augmented supervised learning
Idea:
- Augment the labeled data in a basic way.
Details:
- Start with configuration 1.
- Make some
(image, label)datapoints undergo affine transformations. Transformation parameters are sampled from these distributions:- Do horizontal flip. Sampled from with equal probability.
- Do zoom. Sampled from with equal probability.
- Zoom amount. Sampled from log-uniformly.
- Do rotation. Sampled from with equal probability.
- Rotation amount. Sampled from uniformly.
- Do translation. Sampled from with equal probability.
- Translation amounts. sampled from uniformly.
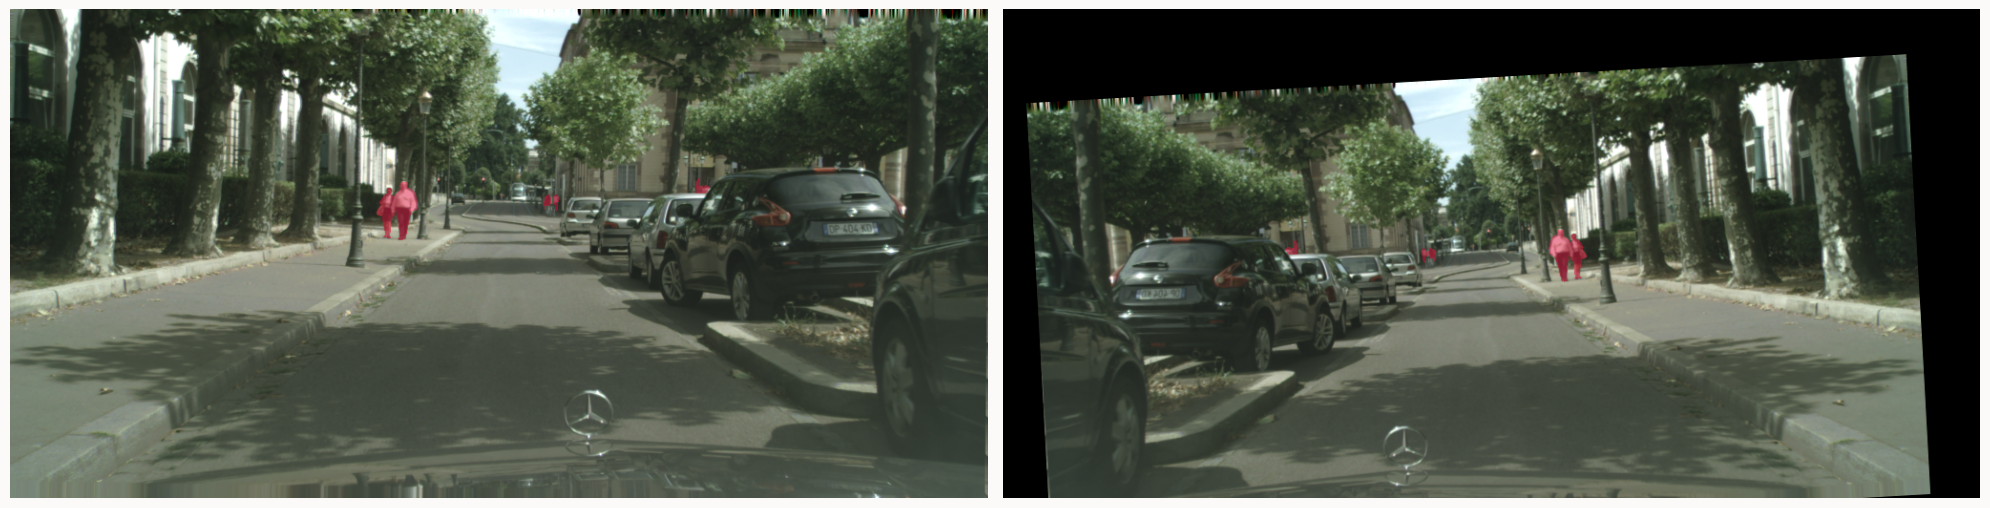
hflip=1, zoom=0.90, rotate_degrees=-3.17, translate_x=-0.01, translate_y=0.09.
Code:
TRAINING_PRESETS["aug_sup"]in train_config.py.
Configuration 3: augmented semi-supervised learning
Idea:
- Apply semi-supervised learning in a basic way.
Details:
- Start with configuration 2.
- Use a training dataset of the 487 labeled training frames (French, Swiss) and the 89,250 unlabeled training frames (French, Swiss, German).
- Use a warm up period of 250,000 datapoints. Meaning: after 250,000 datapoints seen, initialize & use a "teacher model" to generate auto-labels.
- Use a teacher lag of 50,000 datapoints: each time the teacher model is updated, it's updated using the main (student) model from 50,000 datapoints ago.
- Use a teacher EMA decay of 0.9. The teacher model is updated using the
sum:
teacher_model = 0.9 * teacher_model + 0.1 * teacher_update. - Use a hybrid batch ratio of (labeled, unlabelled) = (2, 6). In each batch, 2 samples from from human-labeled data, 6 samples from auto-labeled.
Code:
TRAINING_PRESETS["semi_sup"]in train_config.py.
Results
I ran trainings with the above configurations, and saw some interesting results.
Loss statistics
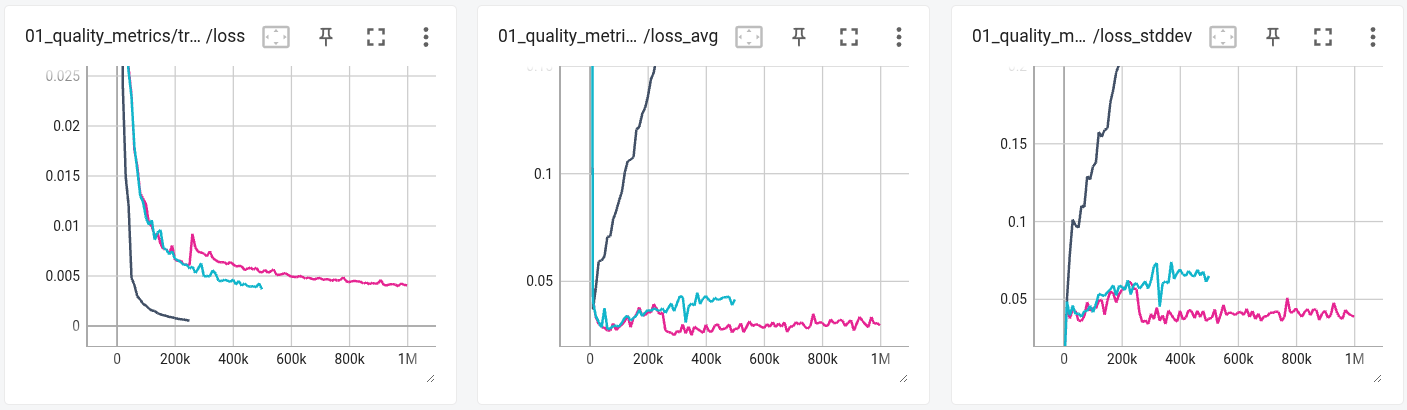
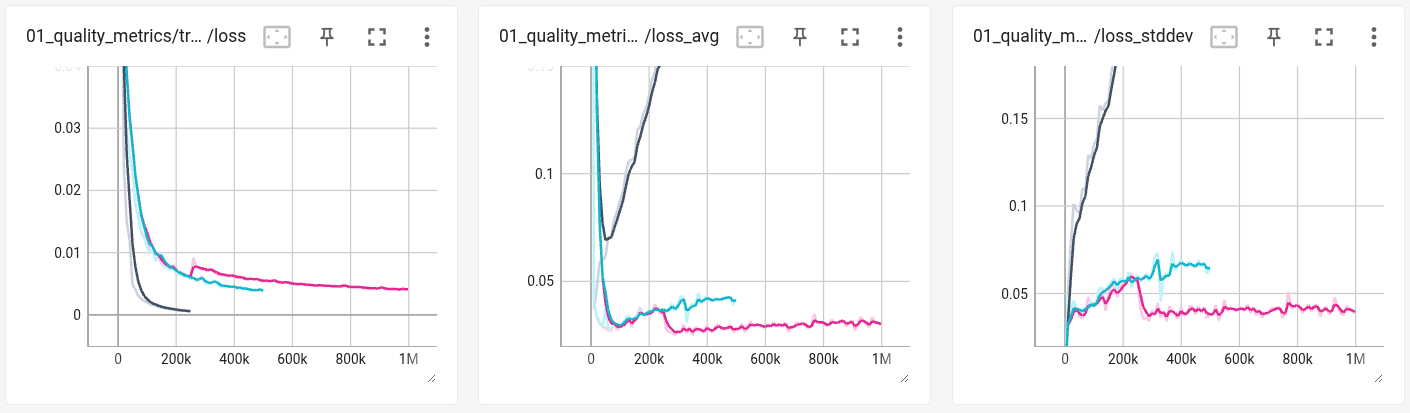
Rows: (top) raw values, (bottom) EMA smoothed with a factor 0.50.
Key points:
- Configuration 1 almost immediately overfits: its minimum val loss happens at 10,000 datapoints, the first log.
- Configuration 3 has a distinctly lower val loss and val loss variance after semi-supervision is introduced at datapoint 250,000.
Evaluation statistics
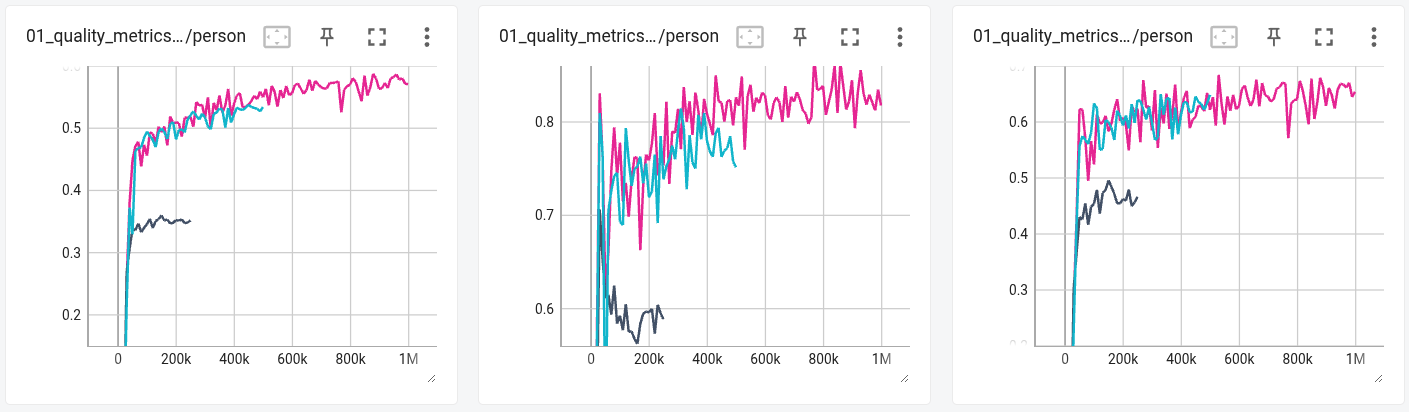
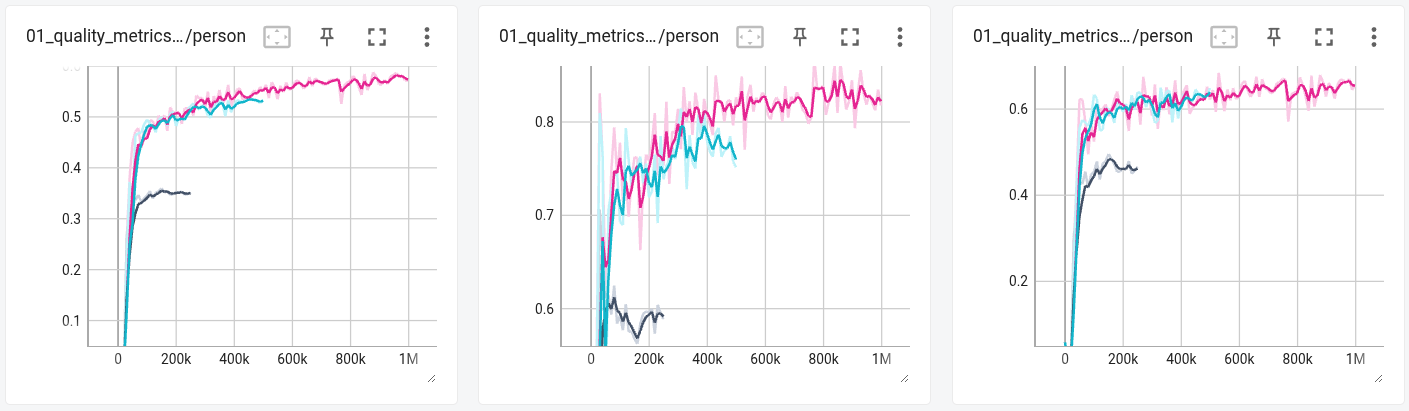
Rows: (top) raw values, (bottom) EMA smoothed with a factor 0.50.
Key points:
- Configuration 3 has a distinctly better precision than configuration 2. At 500,000 datapoints it's already 82.7% (3) vs. 75.1% (2).
- Configuration 2 & 3 have similar recall. At the end of both runs (1,000,000 datapoints for (3), 500,000 for (2)) it's 65.4% (3) vs. 64.8% (2).
Video inspection
Top row: (left) human labels, (right) configuration 1.
Bottom row: (left) configuration 2, (right) configuration 3.
Qualitatively, I think the following order describes the amount of flickering in the videos, from least to most: configuration 3 < configuration 2 < configuration 1.
This is in line with what the "loss standard deviation" metric tells us.
Theory
I'd like to try to make sense of what's driving the above observations.
Augmentation
We saw adding data augmentation made configuration 2 avoid overfitting that configuration 1 had. I think the mechanism at play is illustrated in the diagram below.
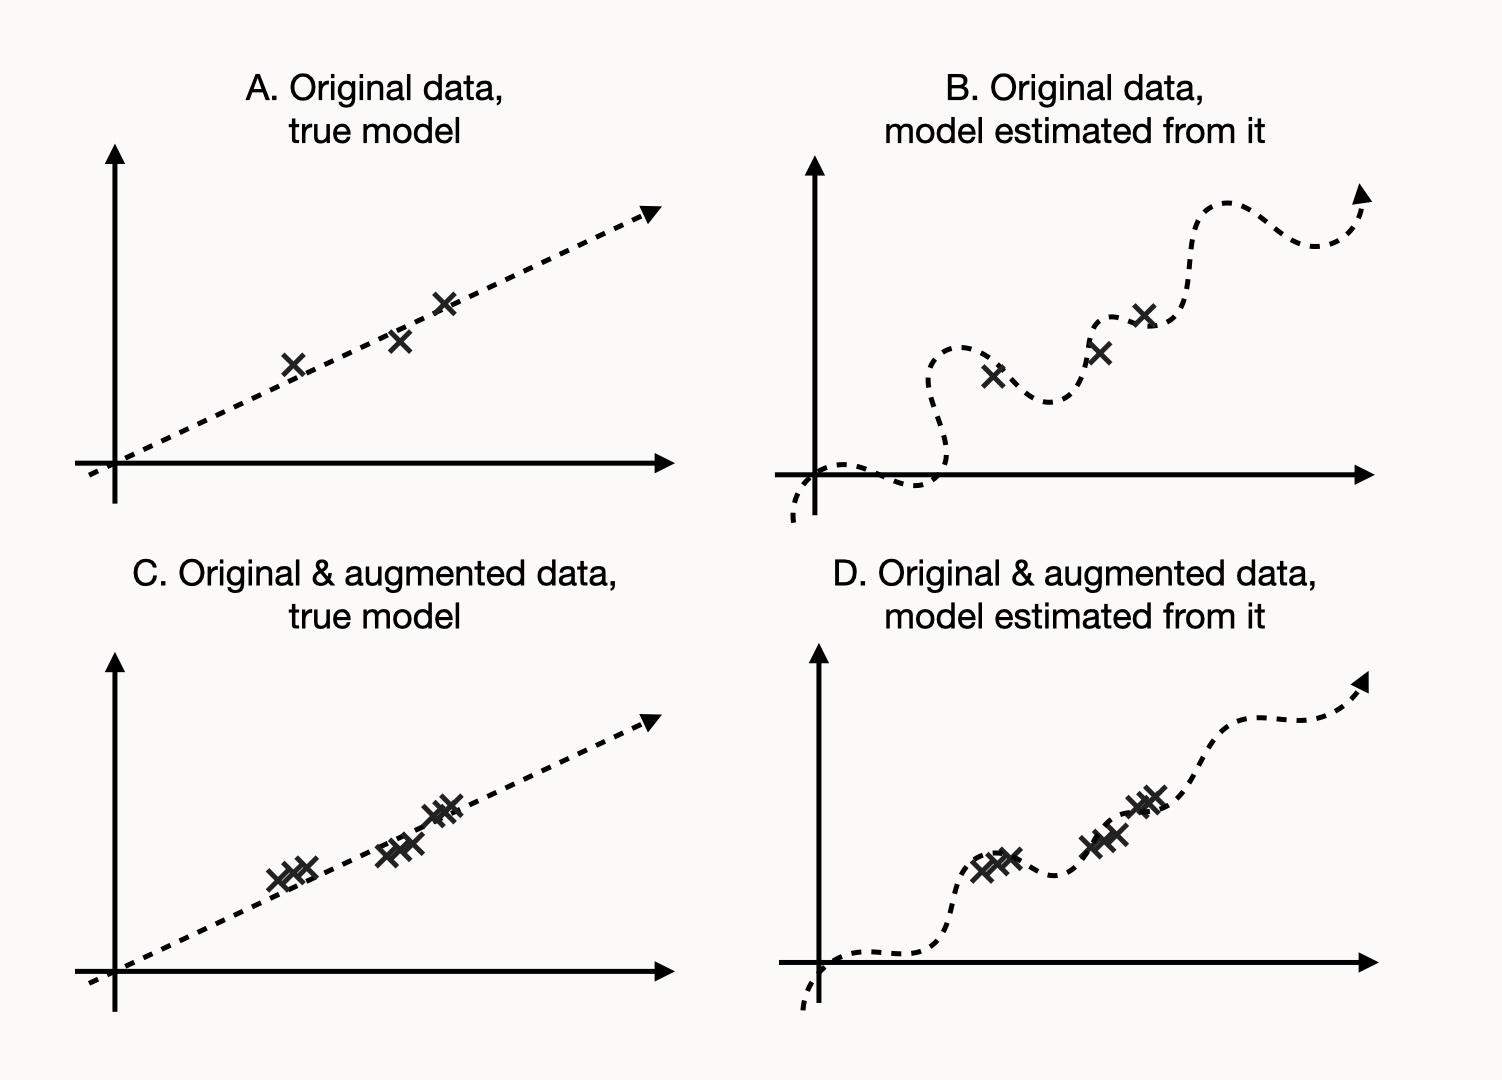
In each existing datapoint's neighborhood, we can reliably generate additional correct datapoints: affine transformations preserve correctness of labels.
Those additional datapoints add value: they constrain curves fit to the dataset in a way that is in line with the true function.
Semi-Supervision
We saw adding semi-supervision made configuration 3 have higher precision & lower variance than configuration 2. I think a similar mechanism is at play.
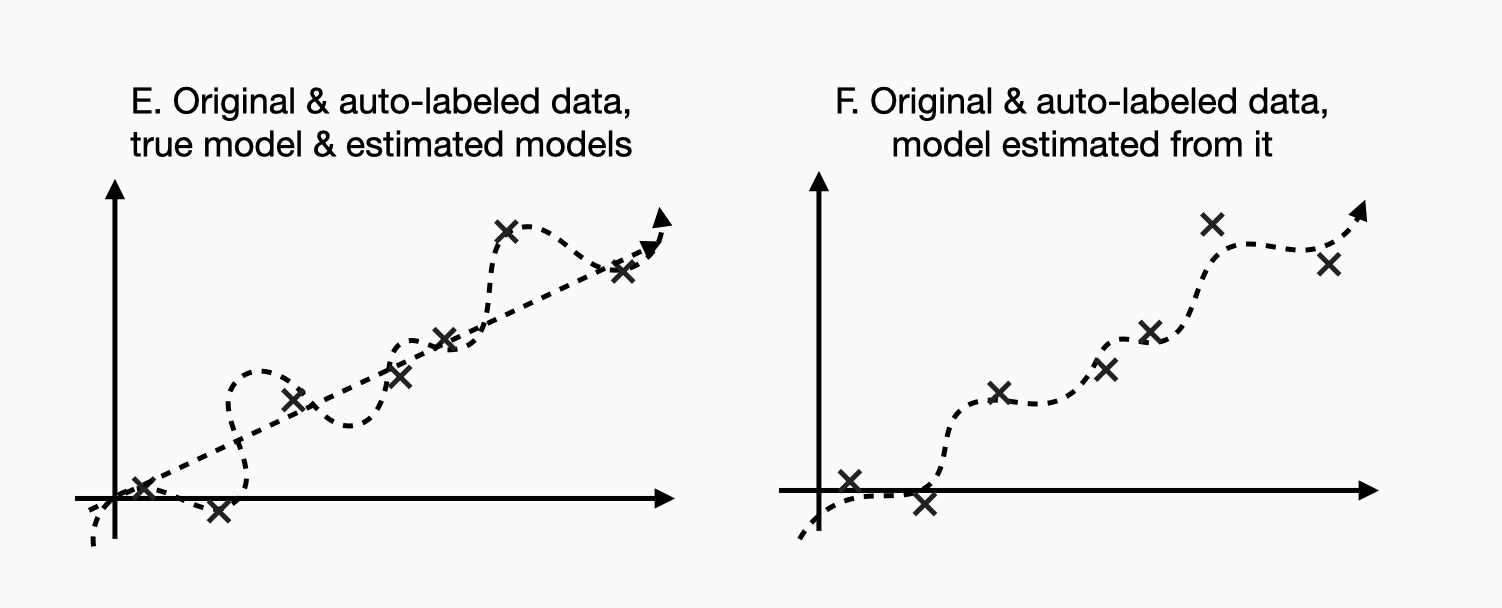
Outside the existing dataset domain, we generate additional somewhat correct datapoints, that average out to be close to correct.
The learned function is most accurate around the existing datapoints. It could be the case that, far away from the existing datapoints, the function has higher variance, but still a reasonable bias, relative to the true model.
Similar to the case of augmentation, these additional datapoints could add value by adding constraints aligned with the true function.
But, there is a major assumption in this reasoning: the idea that the original dataset has support for the given "component" (sloped line in the figures).
For model components where this initial support is not present, the original & derived models will be information-less. I think this explains why recall didn't improve.
Discussion
I think these experiments support some basic ideas about semi-supervision:
What it can do: refine an existing model component.
I.e. increase precision and reduce variance for a component sufficiently represented by the model, from the original data.
What it can't do: induce a non-existing model component.
I.e. increase recall for a component not sufficiently represented by the model, from the original data.
Conclusion
In this project, I set up a basic vision task and applied semi-supervision to it.
It had favorable effects: increased precision & decreased variance, at no recall cost.
I think simple semi-supervision should be a standard method, like data augmentation.
Further Work
The main questions I have now are about the idea of "model components".
Theoretically, it would be interesting to try to define them rigorously.
Experimentally, it would be interesting to try to probe for information about them.
I think models probably vary significantly in how good their components are.
- E.g. CNNs will have different
components for "person looking straight on", "person 45 degrees turned
clockwise", etc.
- More representative models might have fewer person components. Which would make them able to get more value from semi-supervision.
I'd like to try MaskFormer on the above task and inspect its behavior relative to U-Net.
Related Work
There's a lot of good literature about semi-supervised learning. Some selected papers:
- (2018) "Mean teachers are better role models: Weight-averaged consistency targets improve semi-supervised deep learning results" by Tarvainen et al.
- (2020) "Naive-Student: Leveraging Semi-Supervised Learning in Video Sequences for Urban Scene Segmentation" by Chen et al.
- (2021) "Pseudo-labeling for Scalable 3D Object Detection" by Caine et al.
- (2022) "Consistent-Teacher: Towards Reducing Inconsistent Pseudo-targets in Semi-supervised Object Detection" by Wang et al.
Footnotes
The dataset has fine labels & coarse labels. I'll only use fine labels in this project ↩︎
Cityscapes has separate "person" (pedestrian) and "rider" labels. I merge them into one "person" class. ↩︎
I wanted to do this instead of using BatchNorm because GroupNorm is less sensitive to small batches. ↩︎